Figure 1
Afan Ottenheimer, January 7, 2001
Miguel de Benito, January 21, 2004
Contents
Many web sites need to create real-time or dynamic charts and graphs. from live data sets. Many users have found PHP a great way for this dynamic creation of images using the GD library and there have been several good articles describing this [] [] []. The advantage of using the server to create an image (server side scripting) is that one does not have to worry about browser compatibility or client operating system compatibility issues. The PHP image generating library uses the GD library to create elementary shapes (elipse, line, rectangle, ...). PHPlot is a graphics library which provides a means by which you can have your (PHP enabled) web server create and manipulate graphs as objects and display the completed graph as an image. Data sets passed to PHPlot use a very convenient way for database driven sites, in rows with y coordinate data.
First, lets discuss how PHPlot works in general with some
terminology. A PHPlot image can consist of several graphs ,
each graph consisting of several elements.
You define an object (e.g. a variable like $graph),
select the properties of the element that compose the graph and "Draw"
what you want into the object. Tipically by selecting the plot type with
SetPlotType and at the end calling DrawGraph. You
can also directly invoke PrintImage, which either inserts the image
into the data streaming to the client or writes it to disk.
In PHPlot there are World coordinates, which are the XY coordinates relative to the axis origin, in the units of the data set; and device (pixel) coordinates which in GD are relative to the origin at the upper left side of the image.
You can think of the "Draw" functions as shaping the image object and the "Print" function as the method of finally creating the digital image. PHPlot is smart enough that if you only have one graph on an image, then the "Print" is done for you automatically. If you do have multiple graphs per image then you'll need to use both the "Draw" and "Print" functions. We'll talk about that a bit later.
Since PHP is a server scripted language you have several options for how you can "Print" the image. You can:
This document explains how to create plots using PHPlot from a PHP script. Information on PHP can be found at www.php.net. Information about the GD library which PHP uses to create images can be found at www.boutell.com. More information about PHPlot can be found at www.PHPlot.com.
You create a PHPlot object by first including the code to be used and then defining the variable:
<?php
include('./phplot.php');  // here we include the PHPlot code
$graph =& new PHPlot();   // here we define the variable graph

//Rest of code goes below
?>
The above code assigns the PHPlot object to the variable $graph. Please,
use that '&' to create a reference, it is needed by phplot's approximation of a destructor,
a facility unavailable in PHP4.
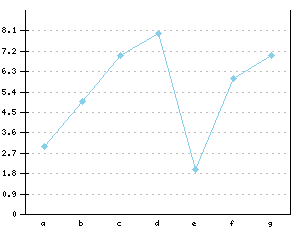
We will start with a simple line graph.
<?php
//Include the code
include('./PHPlot.php');

//Define the object
$graph =& new PHPlot();

//Define some data
$example_data = array(
     array('a',3),
     array('b',5),
     array('c',7),
     array('d',8),
     array('e',2),
     array('f',6),
     array('g',7)
);
$graph->SetDataValues($example_data);

//Draw it
$graph->DrawGraph(); // remember, since in this example we have one graph, PHPlot
                        // does the PrintImage part for you
?>
And that's it! What we get is the following graph:
That's a great start, but now we'd like to specify the width and height of the image.
Lets say we want it to have a width of 300 and a height of 250 pixels.
So instead of having the line
$graph =& new PHPlot();
we replace it with
$graph =& new PHPlot(300,250);
and you have specified the size in pixels of the image to be created.
A couple of things to note:
text-data.
Ok, now we're ready to add some customization to the plot. Let's change
the size, the title and the x/y axis labels. All we need to do is modify
the variable $graph before printing the image. We achieve this with:
<?php
include ('./phplot.php');

//create an graph object 300x250 pixels
$graph =& new PHPlot(300,250);
//Set titles
$graph->SetTitle("Title\n\rSubtitle");
$graph->SetXTitle('X data');
$graph->SetYTitle('Y data');

//...rest of the code


?>
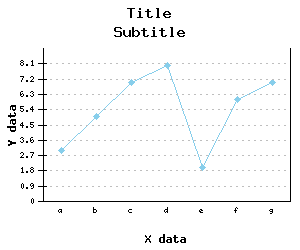
Note that in order for the "\n" and "\r " to be interpreted as
new line/new return characters for SetTitle you have to
enclose the string in double quotes.
Lets say we want to plot not just one
dataset but several y values for each x position. With PHPlot it is
easy to specify the multiple data lines by just passing in all the Y
values for a given X value at once. So instead of array('label', y)
we specify array('label', y1, y2, y3,
...) This is very convenient when working with rows of data from databases.
Now our data will have three Y values for each position on the X axis
<?php
//Include the code
include('./phplot.php');

//Define the object
$graph =& new PHPlot(300,250);

//Set titles
$graph->SetTitle("Title\n\rSubtitle");
$graph->SetXTitle('X data');
$graph->SetYTitle('Y data');


//Define some data
$example_data = array(
     array('a',3,4,2),
     array('b',5,'',1),  // here we have a missing data point, that's ok
     array('c',7,2,6),
     array('d',8,1,4),
     array('e',2,4,6),
     array('f',6,4,5),
     array('g',7,2,3)
);
$graph->SetDataValues($example_data);

//Draw it
$graph->DrawGraph();
?>
Which gives us:
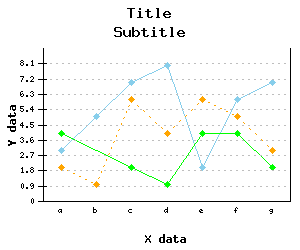
Notice that each set of Y data gets a different color.
Also the missing data point is skipped, this behaviour can be adjusted with
SetDrawBrokenLines(TRUE);
This gives you the basics of how to create a graph in PHPlot. A nice start, but now we'd like to add some customization, namely different fonts, margins and types of graphs.
Valid types of plots (as of PHPlot 5.0):
bars (with optional shadows)lineslinepoints (a faster way of plotting when
you want both points and lines)areapoints (lots of point types here)pie (2D or 3D)thinbarline (sometimes also called impulse) error bar (which can also be used for stock market data graphs)squared (for binary data) You specify which type with the SetPlotType function.
We'll look at that function with bars and lines in the next example when we look at
multiple graphs per image.
As we discussed before, there are several ways we can manipulate the look/feel of the graph object. Almost every parameter of ticks, grids and data labels can be adjusted via (among many others):
SetXTickPos()SetYTickPos()SetXTickLength()SetYTickLength()SetXTickCrossing()SetYTickCrossing()SetXTickIncrement()SetYTickIncrement()SetNumXTicks()SetNumYticks()SetSkipTopTick()SetSkipBottomTick()SetDrawXGrid()SetDrawYGrid()SetDrawDashedGrid()SetDrawXDataLabelLines()SetDrawYDataLabelLines() (not yet implemented)SetXDataLabelPos()SetYDataLabelPos()SetXLabelAngle()SetYLabelAngle()SetXLabelType()SetYLabelType()To create an image with several separate graphs
on it is a straightforward process. As in the previous examples we
first have to create an object (e.g. variable) but now we tell it to
not print the image at the same time as the draw command. Now
we want it to wait for the explicit PrintImage function call.
To tell PHPlot this is the way we want to work, we use the
SetPrintImage function.
SetPrintImage(TRUE) is the default, and tells to draw the image
when DrawGraph is called. To turn this
off we use SetPrintImage(FALSE).
Now we will draw several images entirely within one object. That means that if we set a value for one graph, there will be a couple of other commands we will need.
To specify in pixels the placement of each graph we use
SetNewPlotAreaPixels. The format is
SetNewPlotAreaPixels(upper_left_x, upper_left_y, lower_right_x,
lower_right_y)
. Again we are using the GD coordinates where 0,0
is the upper left corner of the image.
In more detail:
<?php
include('./PHPlot.php');  // here we include the PHPlot code
$graph =& new PHPlot(400,250);   // here we define the variable $graph
$graph->SetPrintImage(0); //Don't draw the image yet

//....Data and Values for first graph here .....

$graph->SetNewPlotAreaPixels(70,10,375,100);  // where to place it

$graph->DrawGraph();   //Draw the first graph to the image.

//....Data and Values for second graph here .....

$graph->SetNewPlotAreaPixels(70,120,375,220); //where to place graph 2
$graph->DrawGraph();  //Draw the second graph to the image

//Print the image with both graphs
$graph->PrintImage();
?>
Lets now create an image with 2 graphs on it with some example data.
<?php
//Include the code
include('./phplot.php');

//Define the object
$graph =& new PHPlot(400,250);

$graph->SetPrintImage(0); //Don't draw the image until specified explicitly

$example_data = array(
     array('a',3),
     array('b',5),
     array('c',7),
     array('d',8),
     array('e',2),
     array('f',6),
     array('g',7)
);

$graph->SetDataType("text-data");  //Must be called before SetDataValues

$graph->SetDataValues($example_data);
$graph->SetYTickIncrement(2);  //a smaller graph now - so we set a new tick increment

$graph->SetXLabelAngle(90);
$graph->SetXTitle("");
$graph->SetYTitle("Price");
$graph->SetPlotType("lines");
$graph->SetLineWidth(1);

$graph->SetNewPlotAreaPixels(70,10,375,100);  // where do we want the graph to go
$graph->DrawGraph(); // remember, since we said not to draw yet, PHPlot
                     // still needs a PrintImage command to write an image.


//Now do the second chart on the same image
unset($example_data);  //we are re-using $example_data (to save memory), but you don't have to
$example_data = array(
     array('a',30,40,20),
     array('b',50,'',10),  // here we have a missing data point, that's ok
     array('c',70,20,60),
     array('d',80,10,40),
     array('e',20,40,60),
     array('f',60,40,50),
     array('g',70,20,30)
);

$graph->SetDataType("text-data");  //Must be called before SetDataValues

$graph->SetDataValues($example_data);

$graph->SetXTitle("");
$graph->SetYTitle("Verbal Cues");
$graph->SetYTickIncrement(10);
$graph->SetPlotType("bars");
$graph->SetXLabelAngle(0);  //have to re-set as defined above

$graph->SetNewPlotAreaPixels(70,120,375,220);
$graph->SetPlotAreaWorld(0,0,7,80);
$graph->DrawGraph();

//Print the image
$graph->PrintImage();
?>
Which gives us:
You must remember that world Coordinates are the XY coordinates relative to the axis origin that can be drawn. Not the device (pixel) coordinates which in GD are relative to the origin at the upper left side of the image.