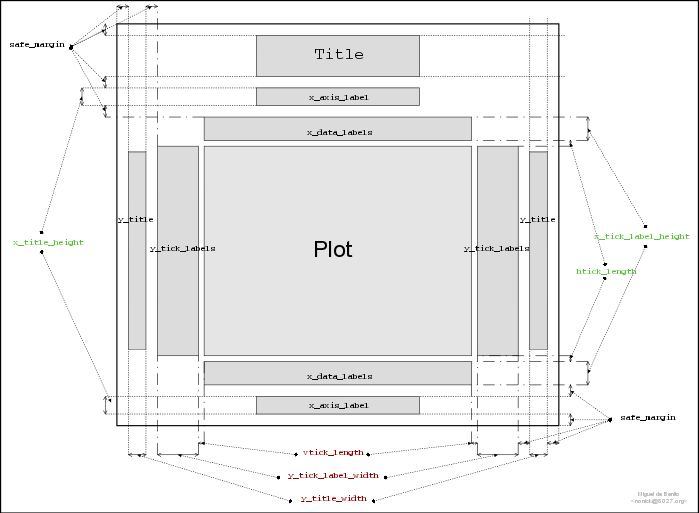
The drawing you can see here is an attempt to illustrate the positioning of elements on the canvas of PHPlot graphs. I'm not specially good at it so please don't complain. I (Miguel) hope it will help somebody as it did with me when I first began browsing through the 3000 lines of code Afan had written.
If you are curious, for the drawing I used Dia a gtk+ diagram creation sofware which I find easy and suited for my purposes.
Creating a graph with PHPlot is easy, you just create an instance of the class, set up a few options, push in the data and smile at your new cute graphic. However here we'll proceed a little more step by step so to show you how to get the most of PHPlot. Please go to quickstart.
$Id: schema.html,v 1.1 2005-05-27 14:46:00 gouss Exp $